

In the previous article, “About HDR — Part 1,” we compared SDR and HDR images. This time, we will take a closer look at how those images were created and explain the technical background behind them.
Some sections are fairly advanced, but if you are interested in HDR imaging and color pipelines, we hope you will find them useful.
Why We Used AVIF for the HDR Still Images
We used the AVIF format for the HDR still images in this article. AVIF was developed by the Alliance for Open Media (AOMedia), whose members include Google, Apple, Microsoft, and Netflix. Its first formal specification was published in 2019.
Like JPEG, AVIF is designed for compressed still images, but it also supports higher bit depths such as 10-bit and 12-bit, as well as HDR and wide-color-gamut images. It is now supported by most major browsers.
Metadata Required for HDR Display in a Browser
The HDR images were created in the P3-D65 / ST 2084 (PQ) color space and stored as AVIF files. For this project, I developed my own software using libavif. Simply placing image data in an AVIF container, however, does not guarantee correct HDR display in a browser. The file must include appropriate header metadata describing its color primaries and transfer characteristics.
The principal parameters are:
avifColorPrimaries:AVIF_COLOR_PRIMARIES_BT2020orAVIF_COLOR_PRIMARIES_SMPTE432(D65 P3)avifTransferCharacteristics:AVIF_TRANSFER_CHARACTERISTICS_SMPTE2084(PQ)
The color space is defined to clearly specify the meaning of the RGB values.
The avifContentLightLevelInformationBox can also contain the following luminance metadata:
- maxCLL (Maximum Content Light Level): the highest RGB value in the image, expressed in cd/m² or nits
- maxPALL (Maximum Picture Average Light Level): the highest average value among the RGB components, expressed in cd/m² or nits
Based on this information, each device determines how to tone-map and display HDR highlights.
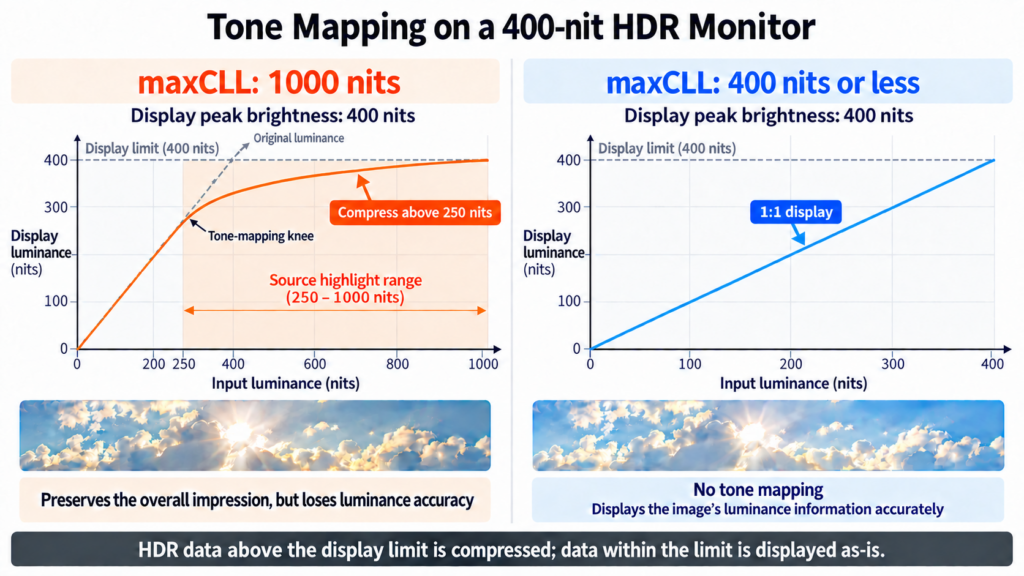
For example, if an image has a MaxCLL of 1000 nits and is displayed on a display with a peak luminance of 400 nits, the device is expected to apply tone mapping so that highlight detail above 400 nits is compressed into the display’s available luminance range. This preserves the overall appearance of the image to some extent, but sacrifices accuracy.
Conversely, if the MaxCLL is 400 nits or lower, tone mapping is generally not expected to be necessary, allowing the image information to be displayed more faithfully without highlight compression.
Measuring HDR Display on a MacBook
To evaluate the actual display response, we measured a 17-step grayscale patch sequence. As a reference, we first measured a high-precision Sony HX310 mastering monitor.
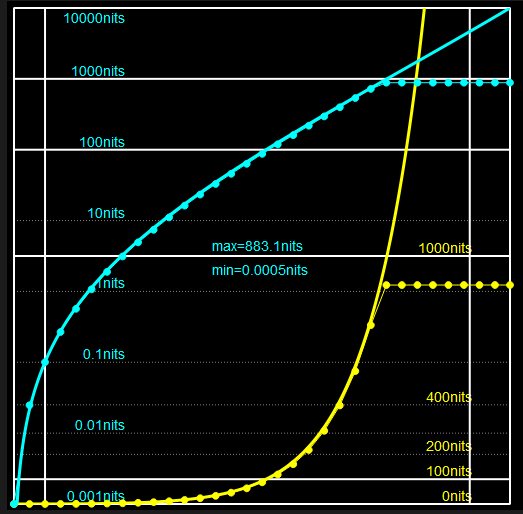
The horizontal axis represents patch values from 0 to 1 on the PQ scale. For a 10-bit signal, we measured 17 points from (0, 0, 0) to (1023, 1023, 1023).
The vertical axis shows either the PQ target luminance or the measured luminance. The bottom corresponds to 0 nits, while the top corresponds to the PQ maximum of 10,000 nits. The cyan curve is the logarithmic target and the cyan circles are the measured values. Their close agreement demonstrates highly accurate reproduction.
From around 1,000 nits onward, the measurements remain nearly constant because signals above the monitor’s peak luminance are clipped at that peak. The yellow curve shows the target on a linear scale, and the yellow measurement points also align closely with it.
Using this response as our reference, we can now examine the MacBook.
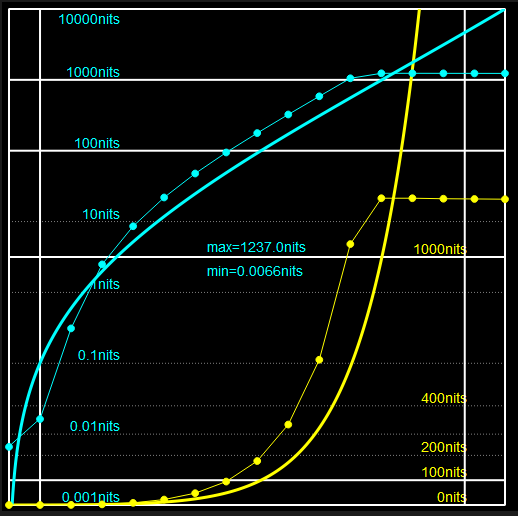
We repeated the measurement on my 2023 MacBook Pro with an M2 Pro processor. Peak luminance reached 1,237 nits, suggesting that limited peak brightness and the resulting tone mapping are unlikely to be major concerns in this machine.
The grayscale response, however, deviated somewhat from the cyan target curve. Therefore, image evaluation using AVIF stills on this MacBook should be treated as a useful reference rather than as a precision mastering judgment.
Still Images and Video Behave Differently
We also created an ST 2084 (PQ) HDR ProRes video and measured it in the same way. The result differed considerably from the still-image test: video playback followed the PQ curve much more closely. Based on this result, the MacBook appears suitable for practical HDR video review.
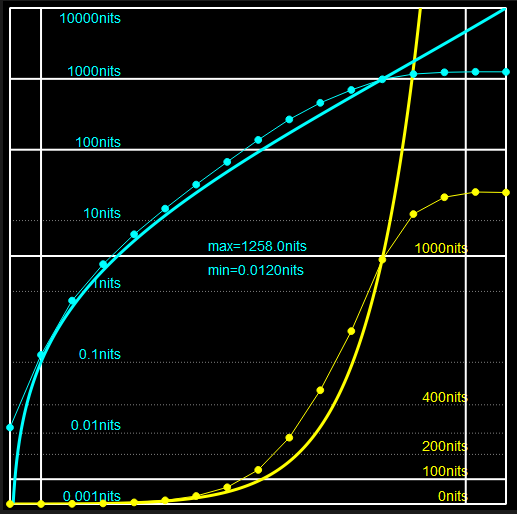
These results suggest that macOS applies different display processing to still images and video. Although the still-image response is not perfectly accurate, the test confirms that HDR highlight luminance can still be reproduced with AVIF images.
The Four Color Pipelines Used in the Comparison
We will now examine the four color pipelines used to create the images in the previous comparison. The source material was developed as S-Log3 / S-Gamut3.Cine.
1. SDR (ACES)
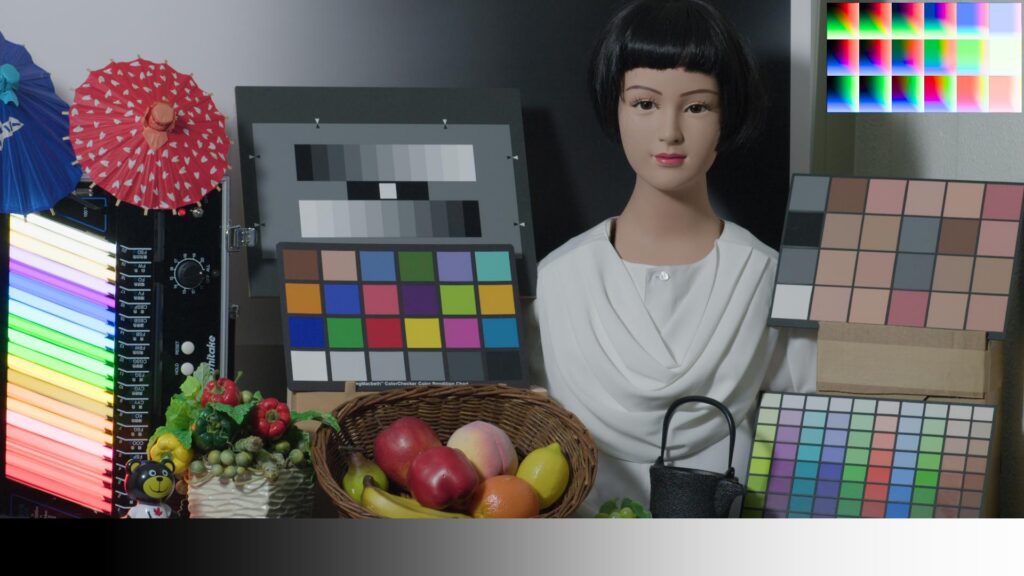
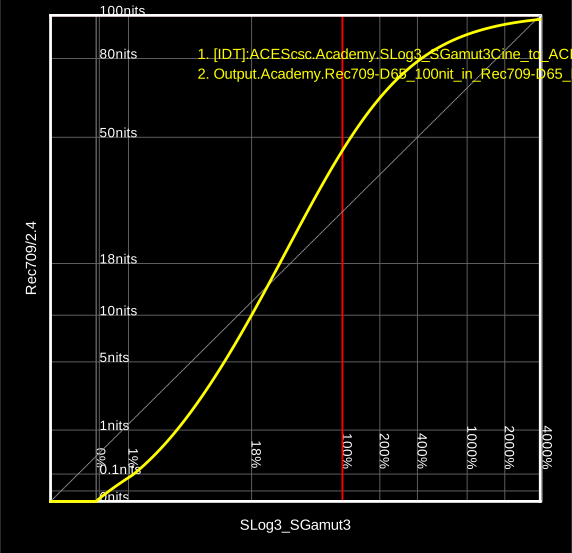
The SDR image was created using ACES 2.0. The S-Log3 / S-Gamut3.Cine source was processed through the ACES color pipeline, converted to Rec.709, and saved as a JPEG.
The tone curve is shown below. The horizontal axis represents S-Log3, and the vertical axis represents full-range Rec.709.
2. SDR (ACES in HDR)
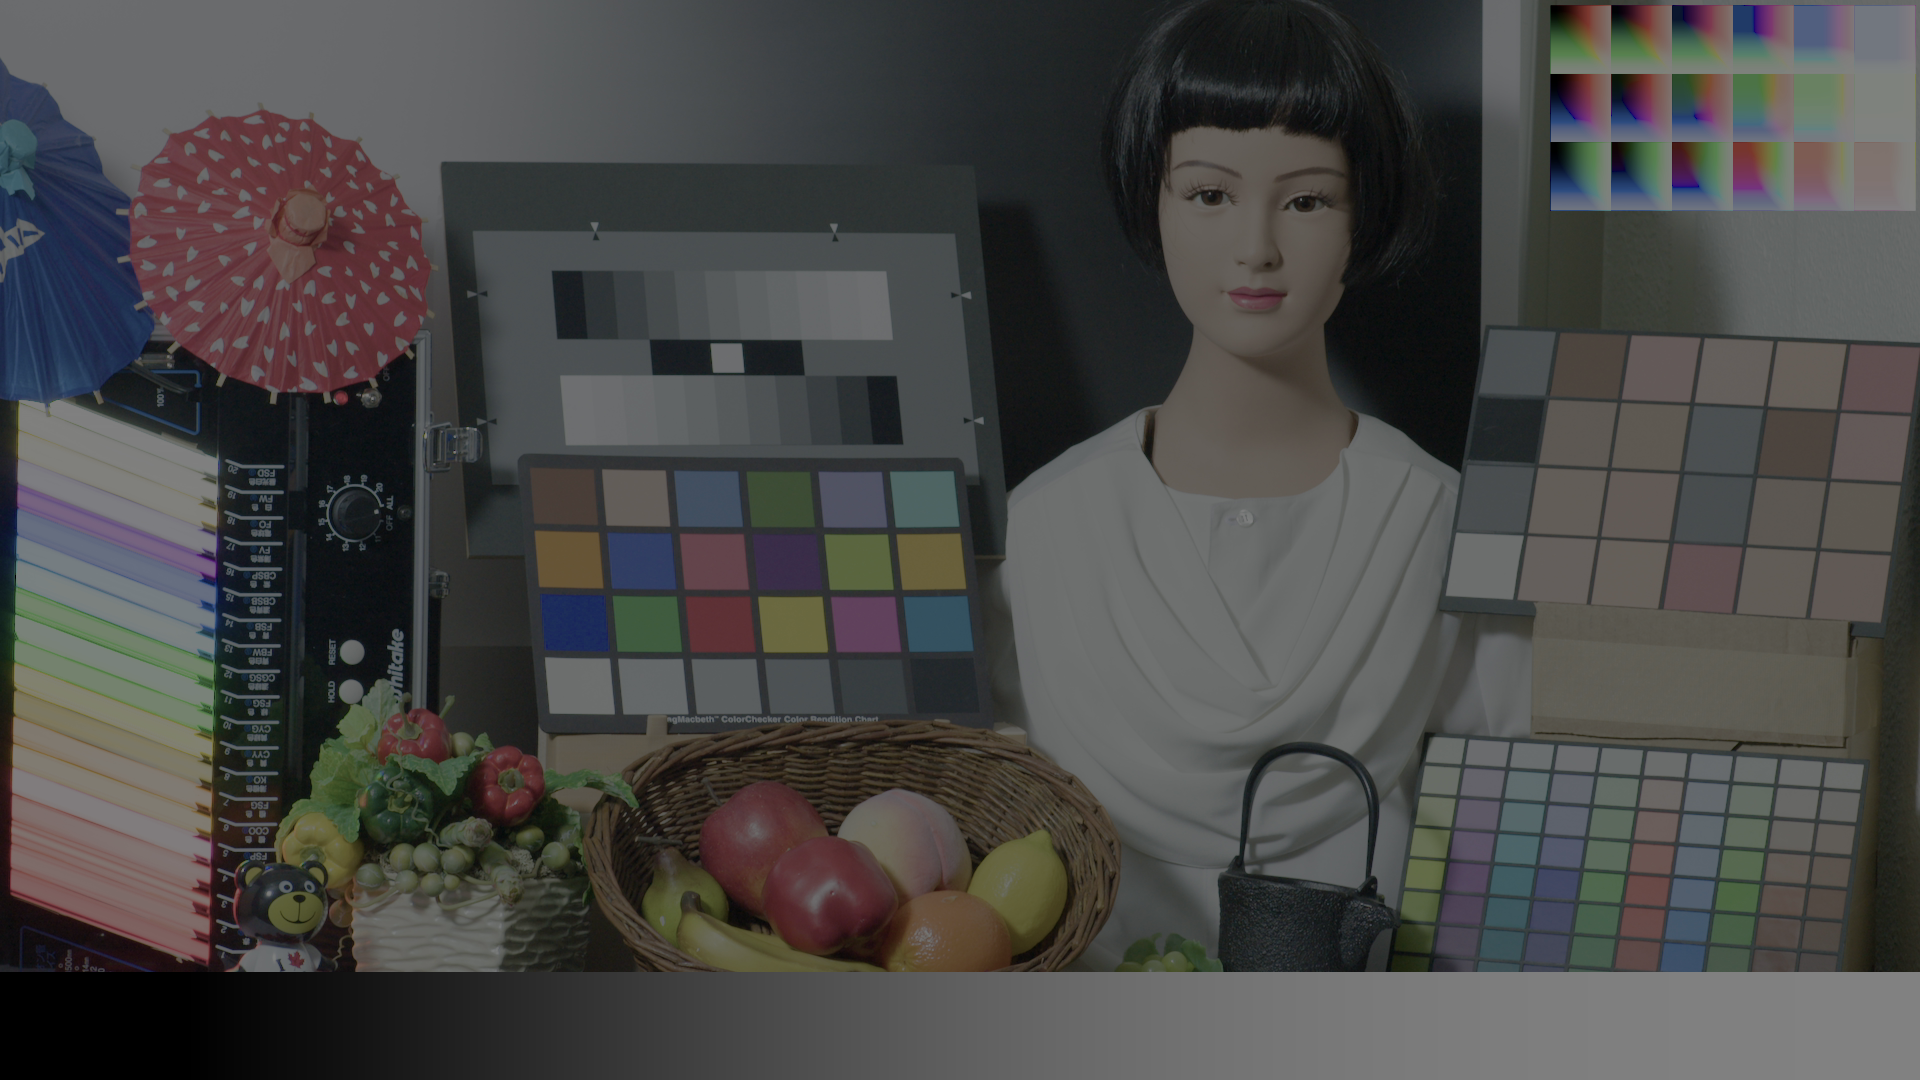
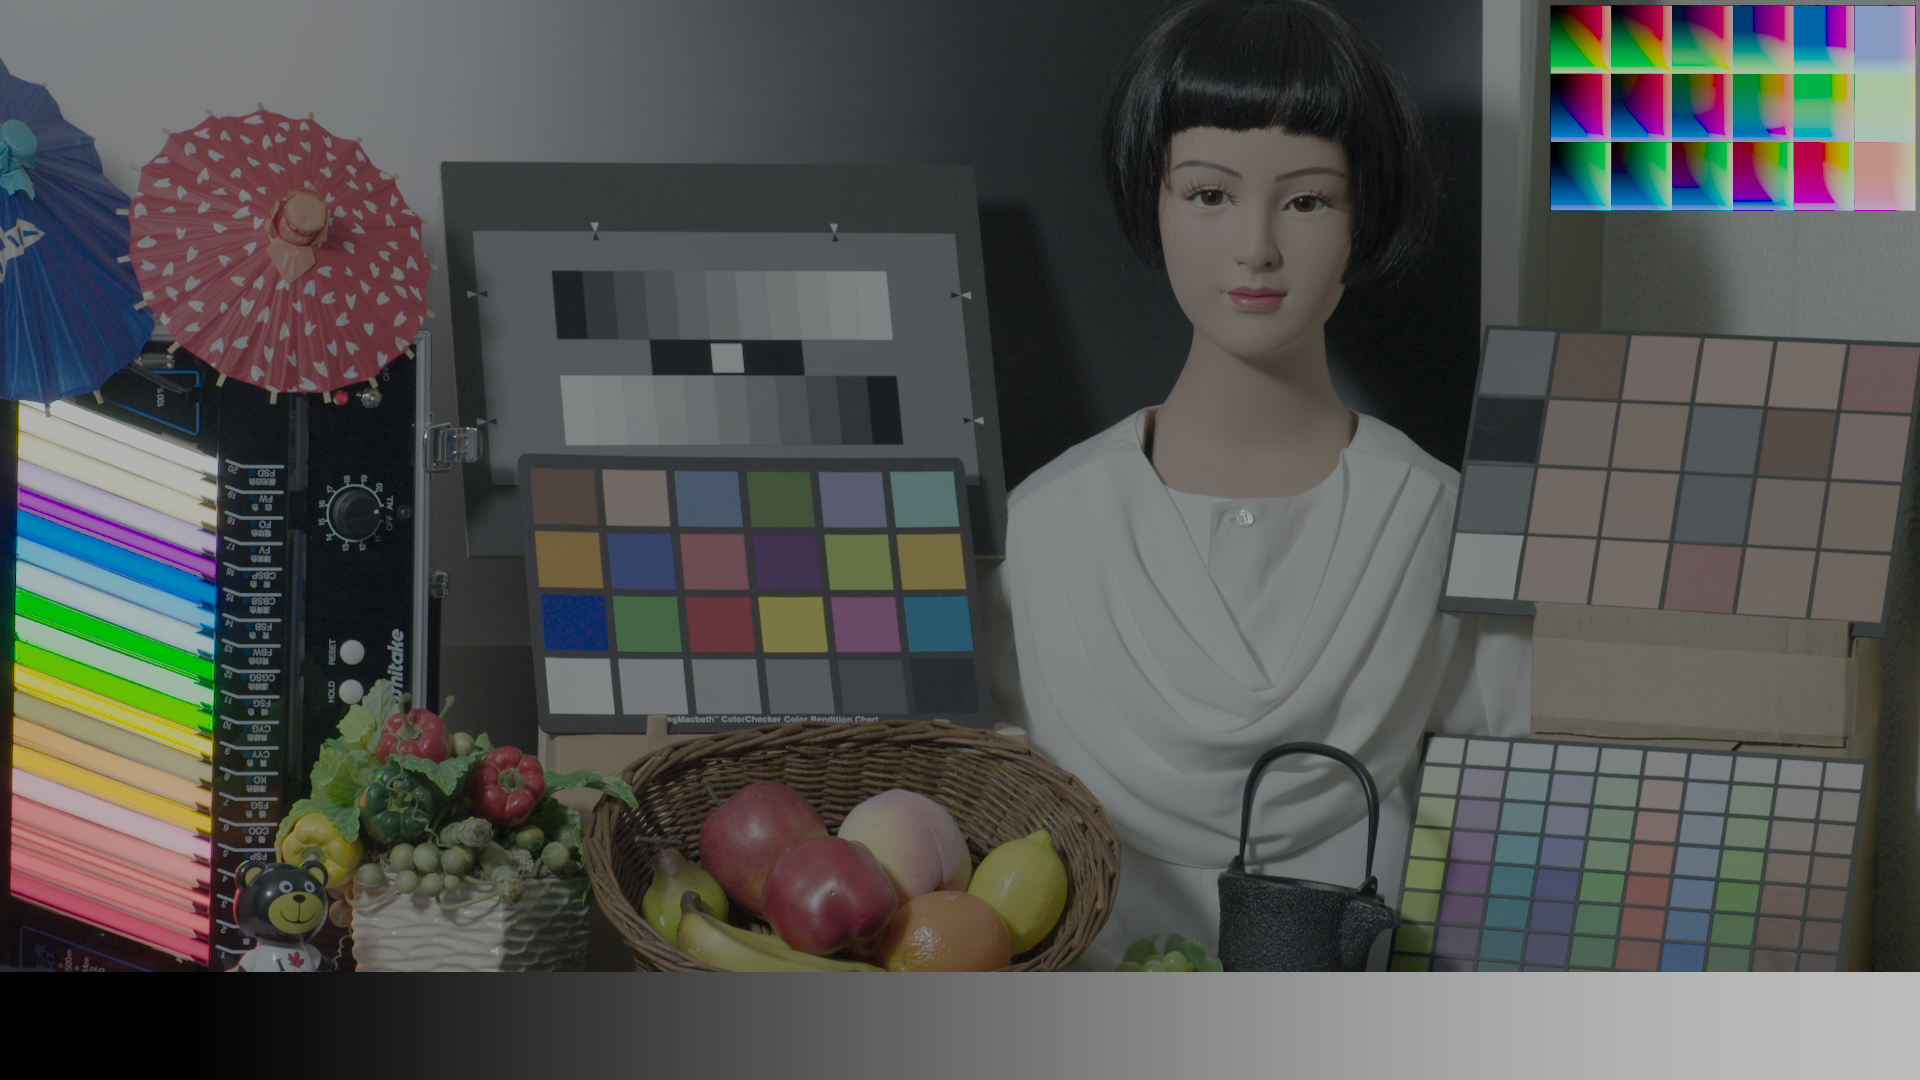
The SDR image placed in an HDR container follows the same processing as “1. SDR (ACES)” through the Rec.709 stage. It is then converted to D65 P3 / ST 2084 using a Color Space Transform (CST).
This CST conversion does not change the underlying color meaning—the XYZ values remain the same. It only recalculates the RGB values for the destination color space. The resulting image is stored as AVIF with the appropriate HDR header metadata. The display path is HDR, but the image’s color and luminance intent remain SDR.

Let’s compare the same image in the same AVIF format, with and without HDR metadata. The image on the left includes HDR metadata, while the one on the right does not.
Why SDR and HDR Appear to Have Different Brightness
Although “1. SDR (ACES)” and “2. SDR (ACES in HDR)” are intended to represent the same colors, they looked quite different on the display. The reason is that SDR and HDR handle display luminance differently.
ST 2084 (PQ) HDR is designed to preserve absolute luminance values as far as the display allows. Whether a monitor peaks at 300 nits or 1,000 nits, image data representing 100 nits is fundamentally intended to be displayed at 100 nits. For that reason, “2. SDR (ACES in HDR)” is shown as an SDR image with a 100-nit peak inside the HDR presentation path.
Professional SDR mastering monitors are generally operated with a 100-nit reference, but SDR brightness on consumer displays depends on the device and playback settings. A display with a 150-nit peak may show SDR white near 150 nits, while another may show it near 80 nits.
SDR behavior on an HDR-capable display above 300 nits also depends on the playback system. In our previous measurements, SDR has often been displayed at around 200 nits.
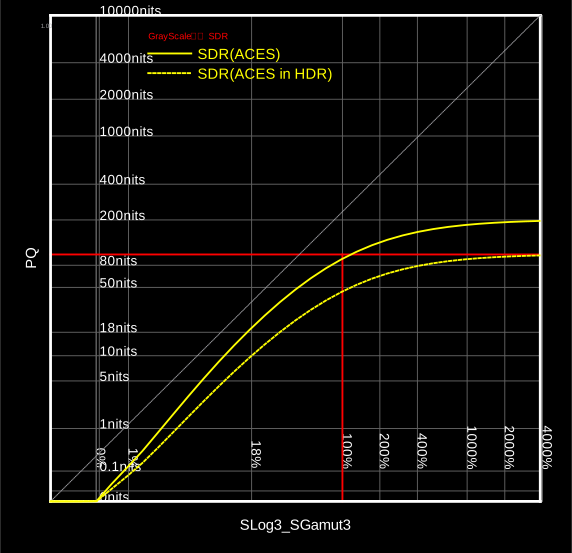
This explains why “2. SDR (ACES in HDR)” appeared darker than “1. SDR (ACES).” The HDR version preserves the absolute 100-nit level, while the conventional SDR version may be rendered brighter than 100 nits by the viewing environment.
I plotted this relationship on a graph. The vertical axis is shown on a PQ scale. SDR is assumed to be displayed at 200 nits.
3. HDR (ACES)
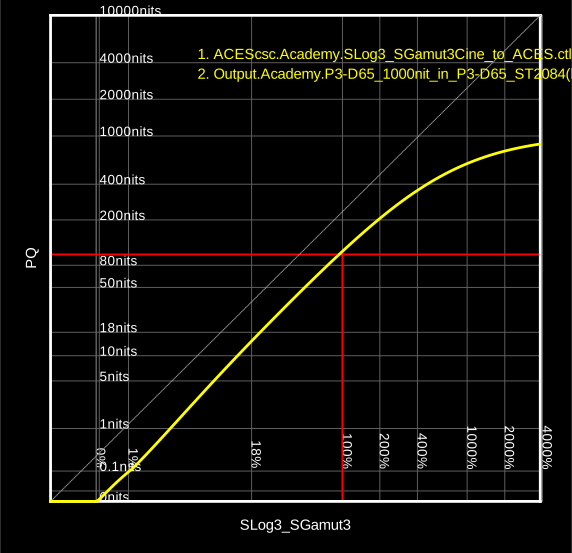
“3. HDR (ACES)” was also created with ACES 2.0. The principal difference from “1. SDR (ACES)” is the output transform. The processing previously described as RRT + ODT is referred to as the Output Transform (OT) in ACES 2.0. Here, we use an HDR Output Transform and save the result as an AVIF image with HDR metadata.

The grayscale graph is shown below. The horizontal axis represents S-Log3, and the vertical axis represents PQ.
4. HDR (Scene)
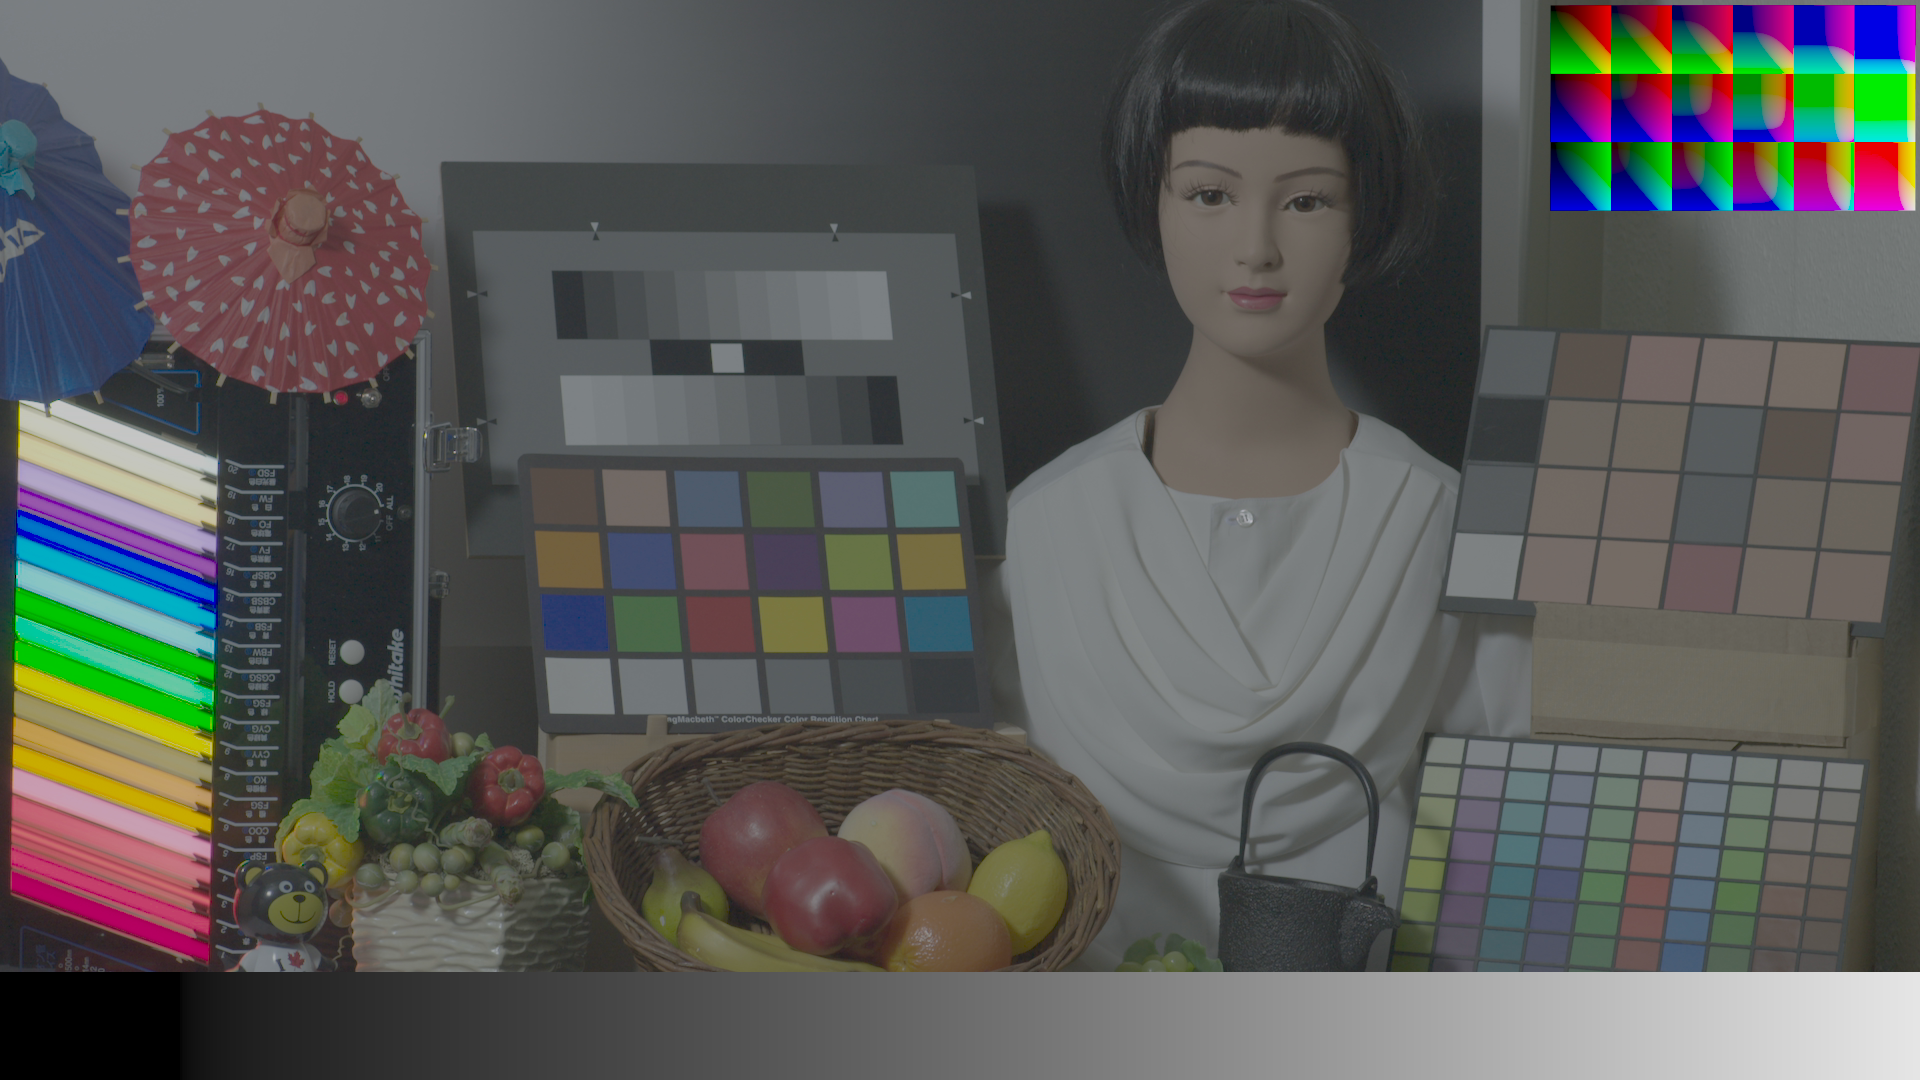
“4. HDR (Scene)” is designed to reproduce the color information captured on set as faithfully as possible on the display.
This pipeline does not include an RRT or ODT. Starting from S-Log3 / S-Gamut3.Cine, it changes only the storage color space without changing the color itself, calculating the corresponding RGB values for that destination. When displayed in HDR, the result can reproduce color and luminance close to the original scene, although errors originating in the camera sensor remain.

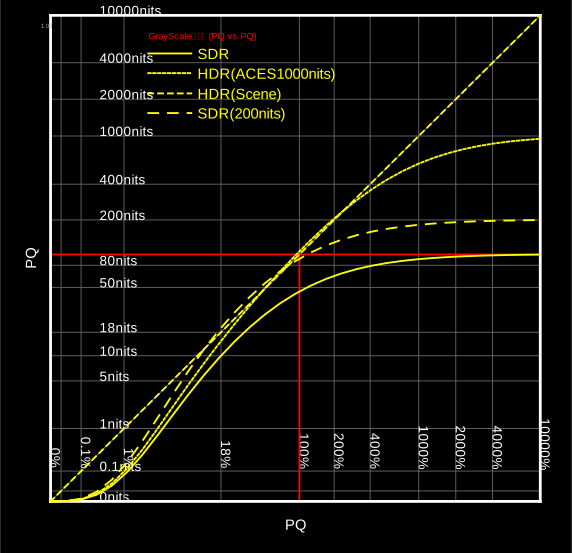
So far, I have explained the color pipelines used to create the four types of images. The graph below combines the grayscale curves for all four types into a single graph.
For easier comparison, the horizontal axis has also been converted to the PQ scale. As a result, “4. HDR (Scene)” appears as a straight 45-degree line.
Summary
In this article, we explained how the SDR and HDR comparison images were created and reviewed the MacBook measurement results. Correct HDR presentation in AVIF requires appropriate metadata for color primaries, transfer characteristics, and content luminance.
We also found that still images and video can produce different display responses on the same device, so the playback path must be considered when evaluating HDR.
Next time, we will evaluate HDR playback environments—including color reproduction—using the MacBook and an LG OLED TV.